Charts
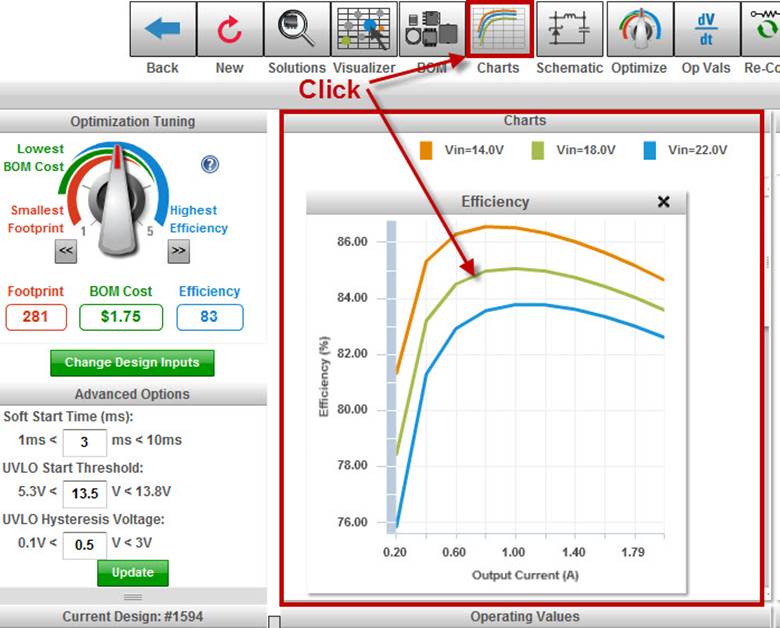
The Charts panel is a graphical extension to the Op Vals table. The charts show the operating value dependence on output current and how that dependence changes with Vin. These operating values are created by the circuit calculator and change for every design. The charts and op vals are updated dynamically when changes to the component values of the circuit are made. The circuit and IC will determine which charts are available for display.
The Charts panel may be accessed by clicking on the Charts icon
or by clicking in the Charts panel directly. The Charts panel will show a few charts by default, in this example, Efficiency vs. Output Current, Duty Cycle vs. Output Current, and Loop Response (Bode Plot) are shown. Note that the Bode Plot only has a single plot of “phase + 180” and gain for the nominal Vin.
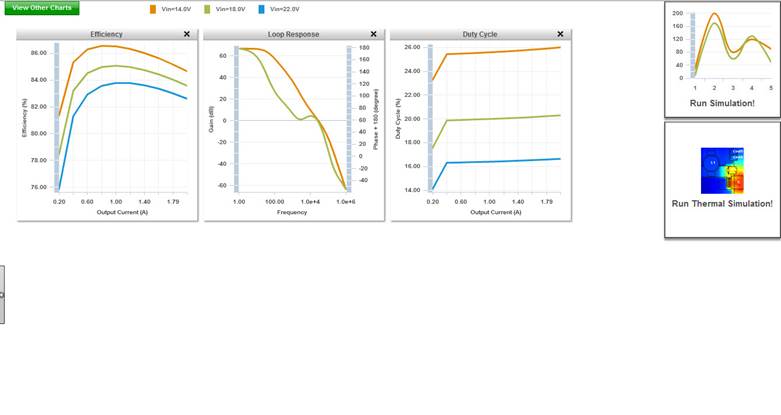
The chart data will be shown for the Min, Typical, and Max Vin values you chose when the design was created. There are several charts available. To see what charts are available for a device, click on the View Other Charts green button on the left side of the Charts panel. This will reveal a list of plots that you can choose to display.
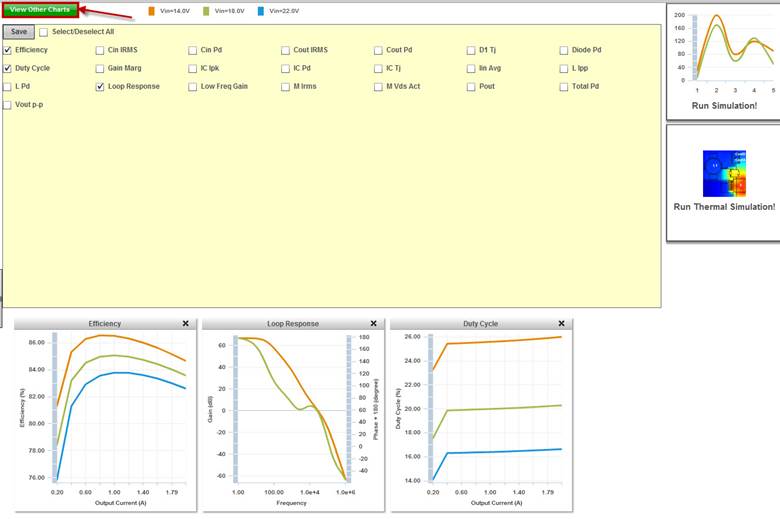
Simply click on the box next to the chart you would like to add and it will appear in the window. You can select all as well (upper right box option). Once you have made your choices, click on the Save button in gray and the charts will appear in the Chars panel.
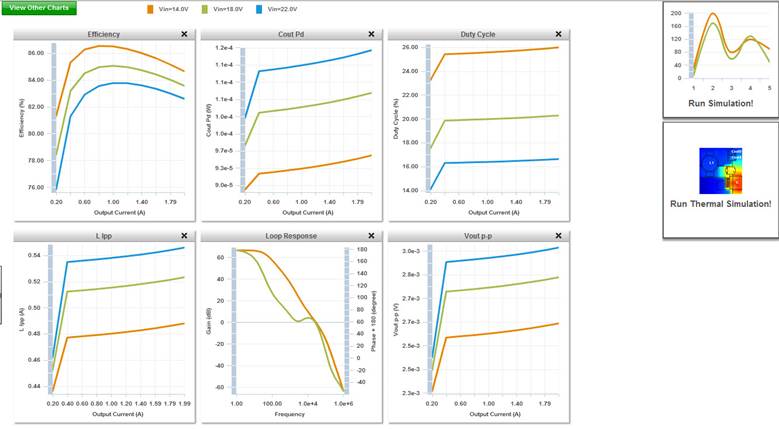
You can remove the chart from the panel by clicking on the X in the upper right hand corner of each plot. This will not update the boxes selected, however, you will need to click on the Save button again to return all of the charts selected. You can also access electrical and thermal simulation through the Run Simulation! or Run Thermal Simulation! icons on the right hand side.