Electrical Simulation
Electrical simulation is useful for guaranteeing the performance of your circuit before continuing to the prototype phase of development. Electrical simulation can give insight into how the circuit will perform under normal or extreme operating conditions, as well as showing the strengths and weaknesses of a specific design. In many cases, the simulation can show how tolerant the circuit is to changes in component values and may provide ways to improve performance of the circuit.
The electrical simulation panel may be accessed using the Sim icon
![]()
or by using the Run Simulation! icon in the schematic or charts panels.
![]()
Once you have entered the Electrical Simulation panel, you will see a schematic on the right hand side and the waveform viewer on the left hand side. There is a drop down menu for the simulation types that can be performed, a Simulation List tab that shows all simulations that have run, a Past Simulations tab that allows you to access previous simulation waveforms, a Start New Simulation green button for starting any new simulations, and several other buttons to access features or simulation information. By default, many circuits will run the Bode Plot automatically (shown in this example). If the Bode Plot is not available, the circuit will not run any simulation without the Start New Simulation button being clicked.
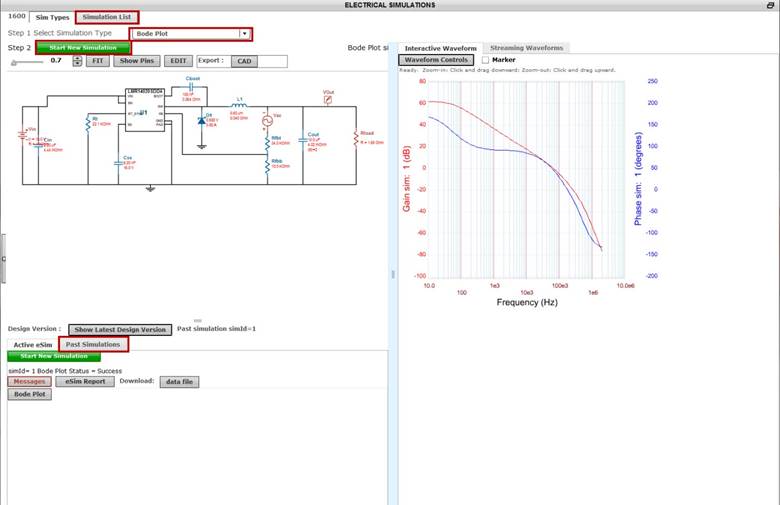
The simulation types that are available are:
1.) Bode Plot
2.) Startup
3.) Steady State
4.) Input Transient
5.) Load Transient
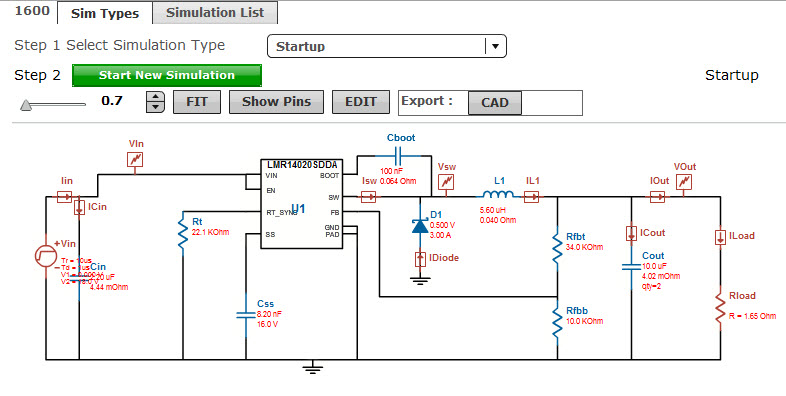
The schematic will change based on the test selected. When choosing Startup, the schematic changes to show all of currents and voltages that will be available to plot.
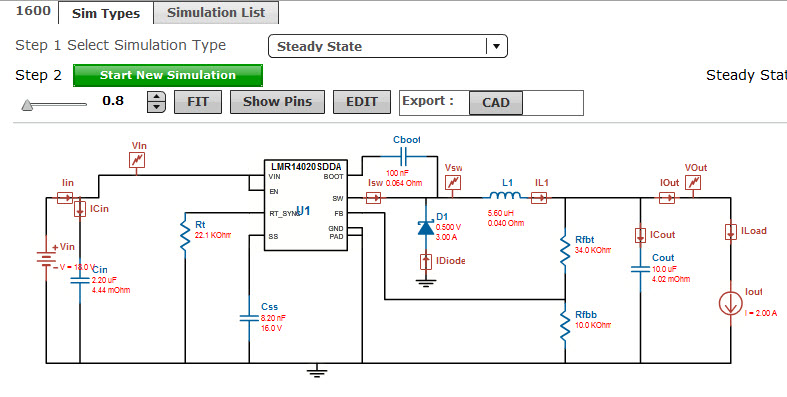
For Steady State, the schematic is updated with a fixed current load instead of a resistive load.
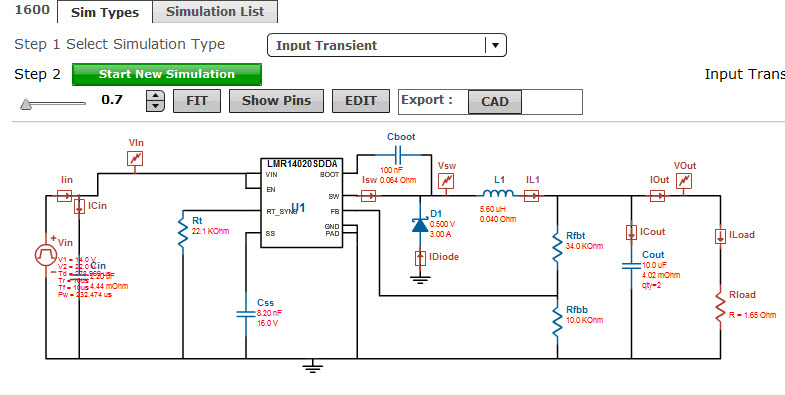
For Input Transient, the input is changed to a pulsed source with the two different voltage values (determined by your inputs and the circuit calculator) updated. There is a delay and pulse width calculated to determine when and for how long the transient is applied based on the steady state timing of the device. The load is set as a resistive load.
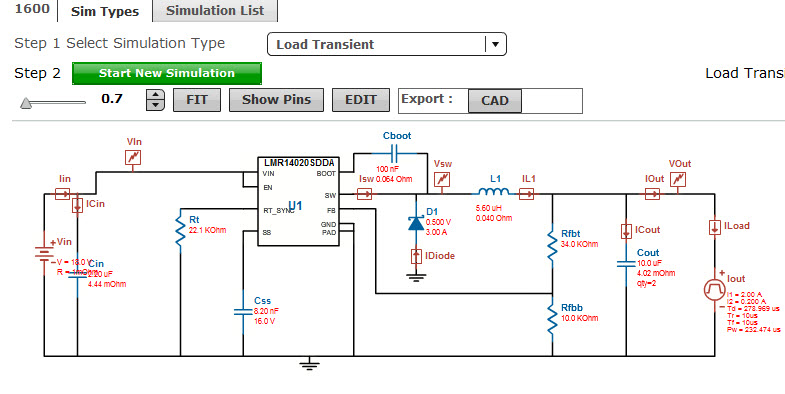
For Load Transient, the load becomes a pulsed source with the two current level values (determined by your inputs and the circuit calculator). There is a delay and pulse width calculated to determine when and for how long the transient is applied based on the steady state timing of the device.
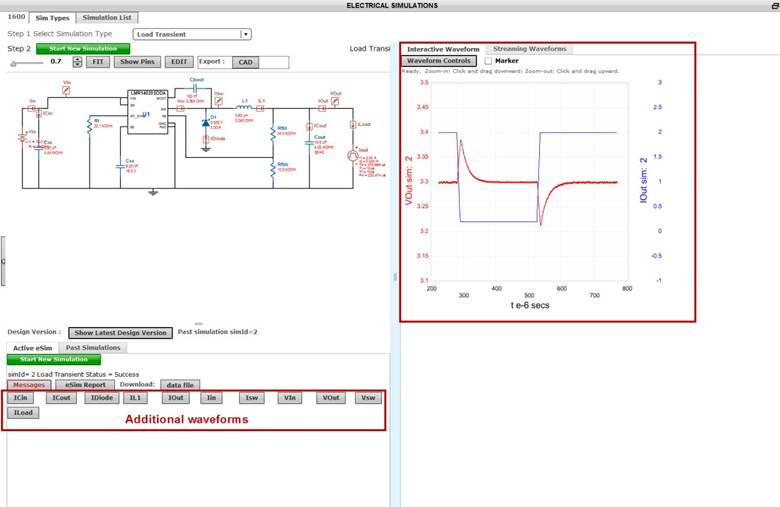
Once a simulation has been performed, the default waveforms will appear in the waveform viewer. Additionally, there will be other waveforms that can be added simply by clicking on the waveform name button in the Active eSim tab.
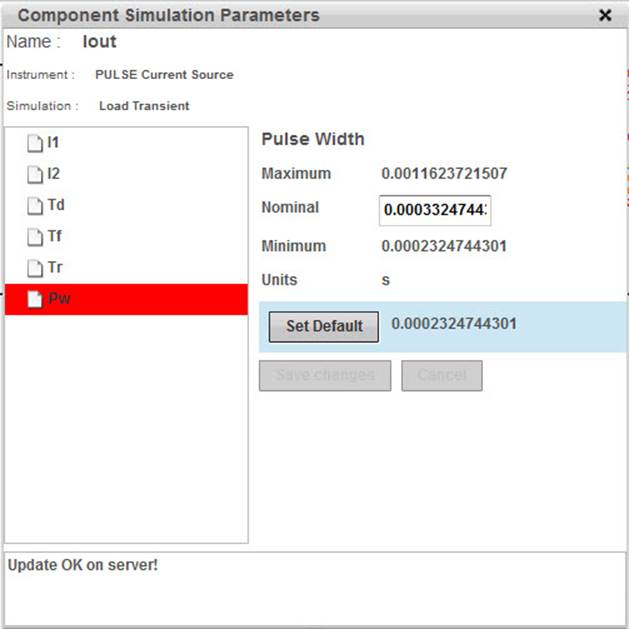
If you would like to run a new simulation of the same type, you may click on the Show Latest Design Version button in gray. You may then edit the load pulse waveform by clicking on the instrument and configuring the pulse. There are limits associated with the waveform cannot be changed. Once you have updated the source, you can re-run the simulation to see the changes applied.
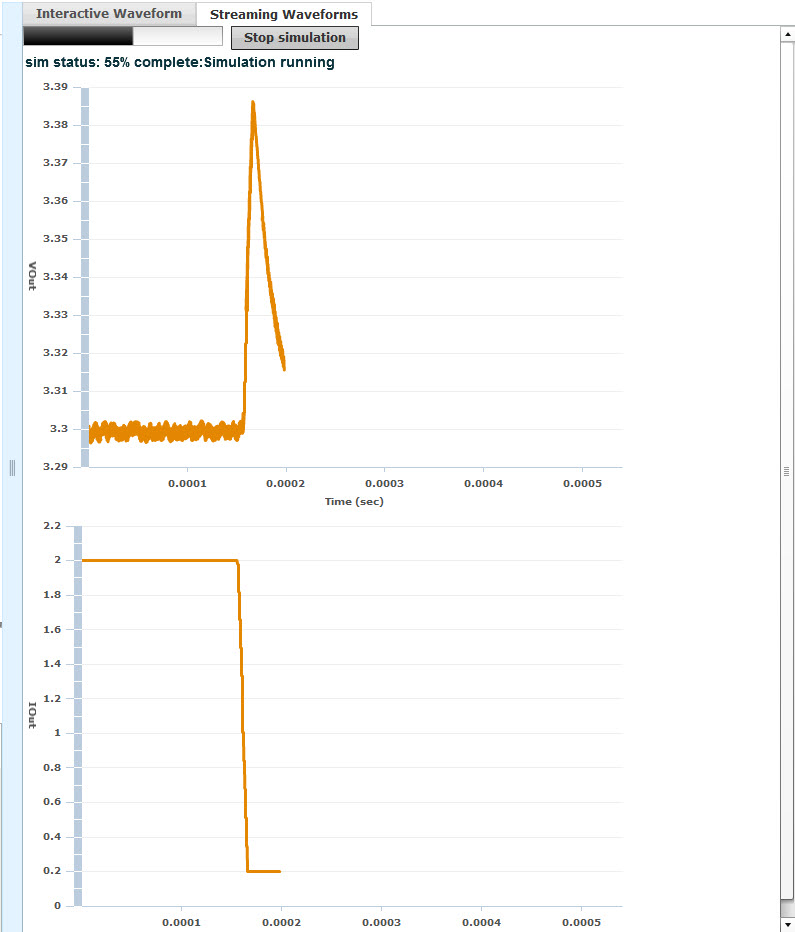
There are streaming waveforms available during the simulation as well.
Once the new simulation is complete, the new waveforms are show with the existing waveforms to see the changes that were applied.
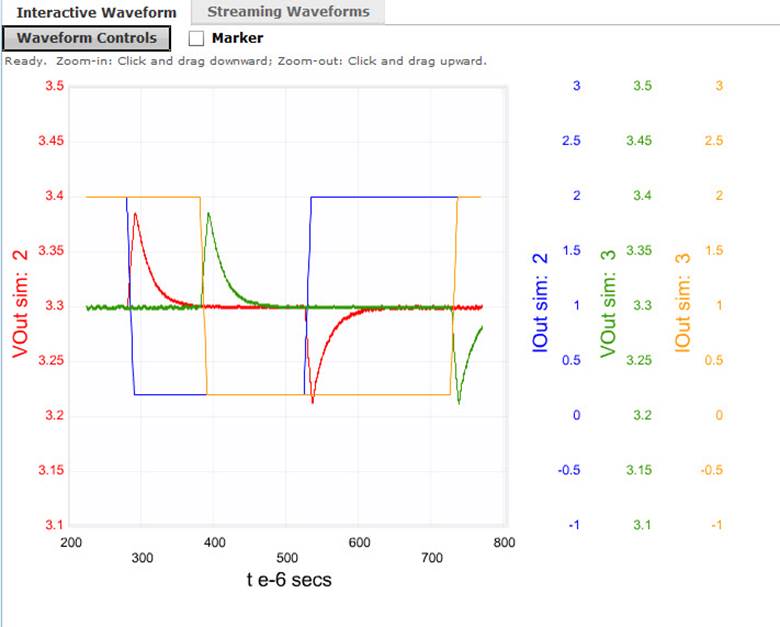
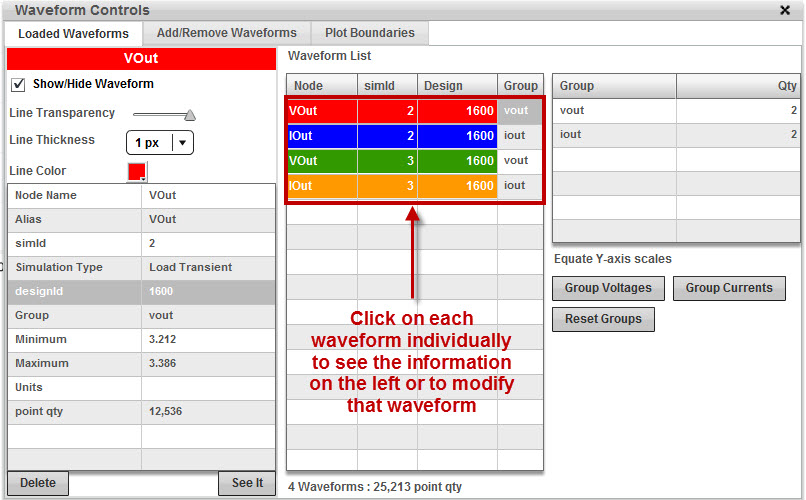
The waveform viewer is easy to use. You can zoom in using the mouse by left clicking and holding to drag a box down and to the left. The waveform will zoom to the box. To reset the graph, simply left click and hold while dragging up and to the right and the waveform will reset. There are many options to use with the waveform viewer. Click on the Waveform Controls button in gray to reveal the window. There are 3 tabs that allow access to various features, the Loaded Waveforms tab, the Add/Remove Waveforms tab, and the Plot Boundaries tab. The Loaded Waveforms tab contains the existing plot information and waveforms. You can hide, delete, modify the thickness, transparency, or color of the line, and group waveforms.
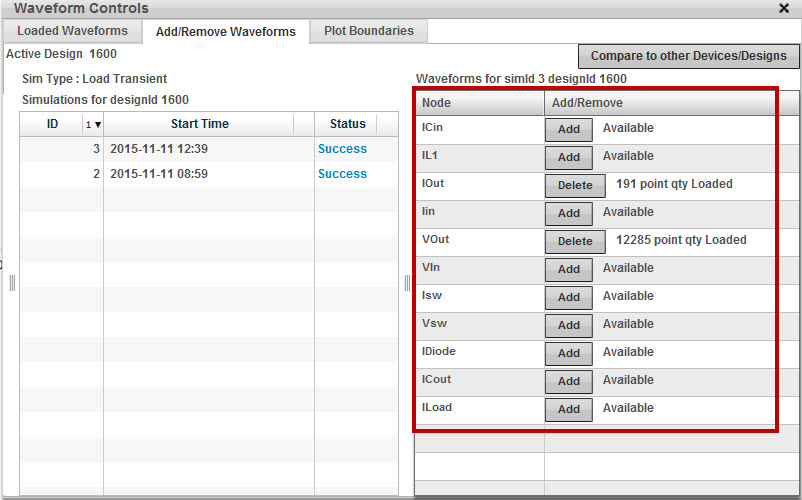
The Add/Remove waveforms tab shows all of the available waveforms to Add to the display. Waveforms that are already present have the Delete option available. The simulation information is presented on the left of the window.
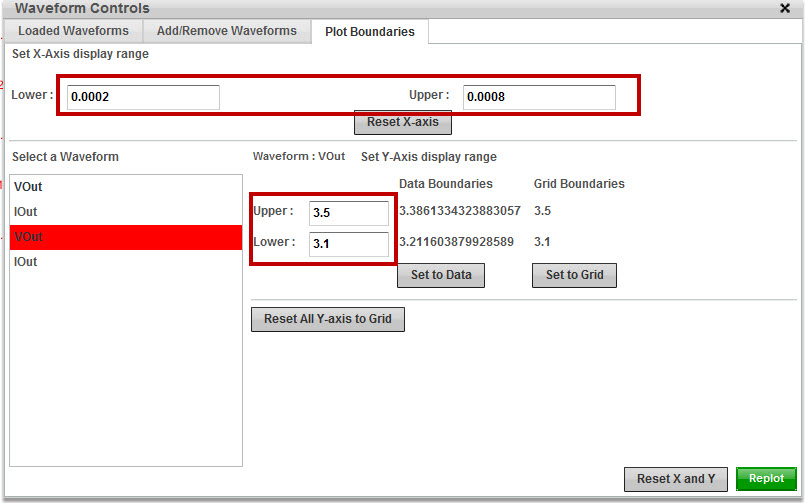
The Plot Boundaries tab allows you to change the x and y axis values. You can click on the waveforms to display the data and grid boundaries for the waveform. You can enter values into the text boxes and change the appearance of the graph and replot the data.
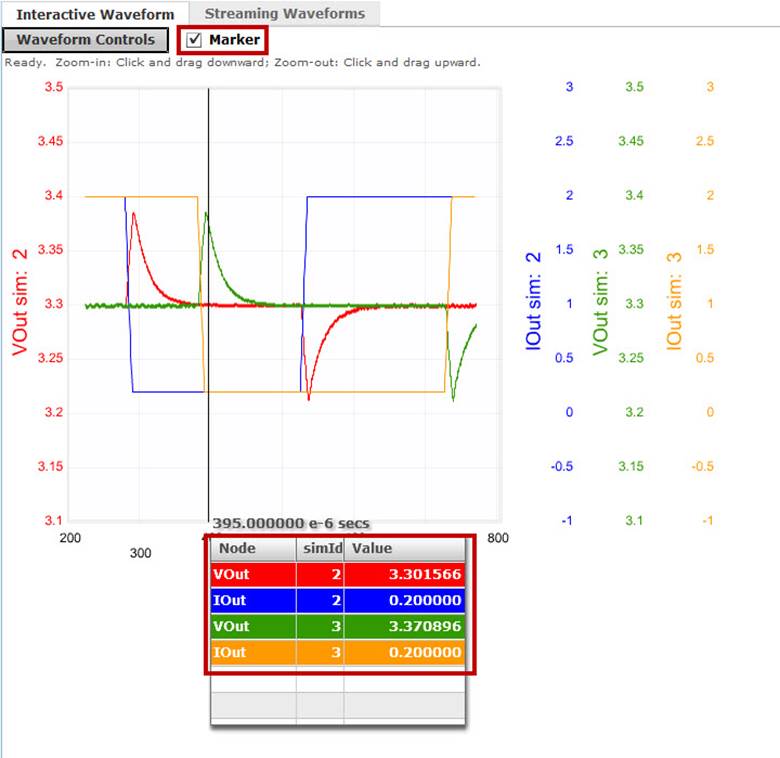
You can place a marker by checking the box next to Marker in the waveform viewer. This will display the value of each waveform at the x location chosen by moving the mouse over the graph.
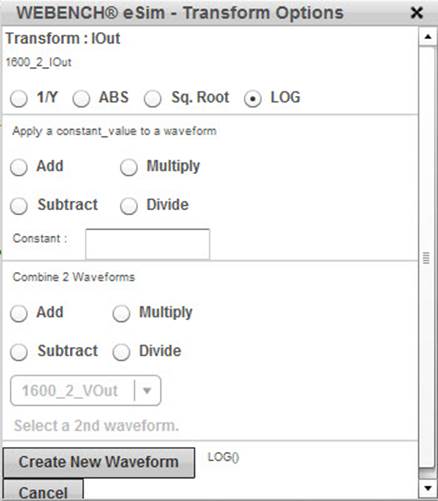
You can also transform waveforms using math expressions/functions. The manipulations may be done on any single waveform or convolving two waveforms to create a new waveform. Right clicking on the name of the waveform will reveal a menu of operations
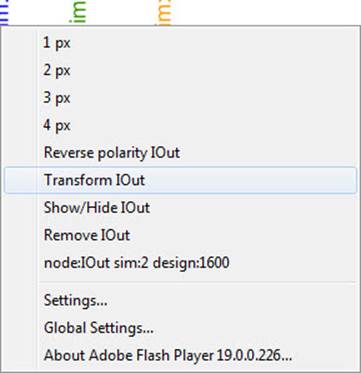
Choosing Transform will show the transforms that are available for one and two waveforms. Clicking on the radio button next to the transform you prefer will select the transform. Then click on Create New Waveform in gray to generate the new waveform. It will appear in the plot with a unique transform name.
